Type of Reports
As an Administrator, you may toggle between two types of report on the top right hand corner :
-
All Reviewees - Result for all reviewees within the same review are consolidated and this allows you to quickly pinpoint the cohort’s strengths as well as gaps.
-
Individual Reviewee - Result of a selected reviewee to better understand the individual’s strengths and developmental needs.
Dashboard
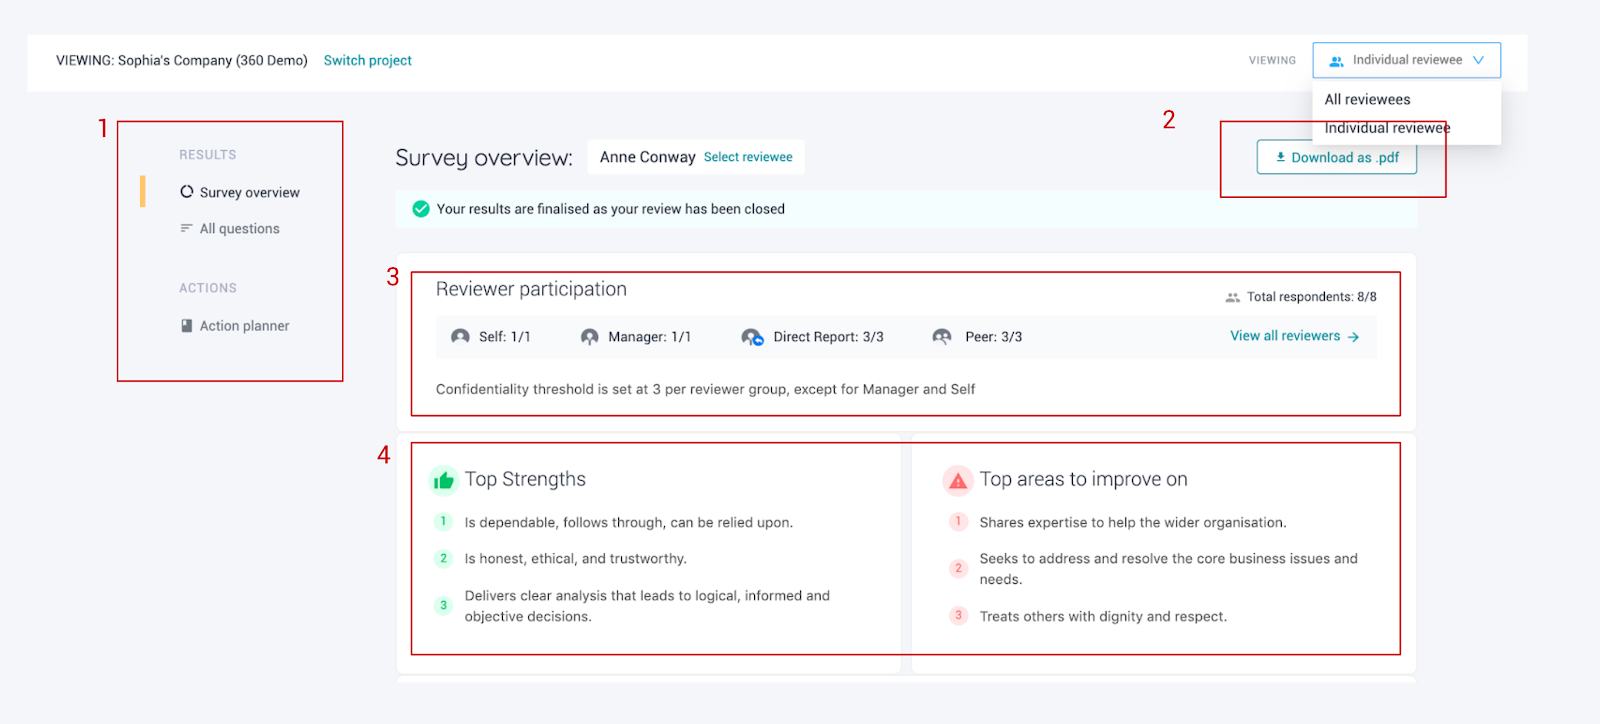
Our Dashboard provides you with a high-level overview of the review results.
-
Left-hand Menu: Toggle between Survey Overview, All questions and Action Planner to see review results, reviewer’s comments, and action plans entered by the reviewee.
-
Download as PDF: You can choose to export the report to PDF which is accompanied by in-depth explanations and reflection points for the results.
-
Reviewer participation: Participation status of each reviewer group is reflected here for the chosen type of report.
-
Top Strengths and Top areas to improve on: The summary gives you an overview of the three statements with the highest scores as well as three areas where reviewees can improve.
Note : When two statements have the same score in the top/bottom 3, the system will randomly pick one of the two statements.
Johari's Window & Spider Chart
With any 360-degree or Multi-reviewer Feedback exercise, we look into gap analysis by contrasting the reviewee’s own ratings against their reviewer's ratings. This gap analysis is presented in two ways: Johari's Window and spider chart.
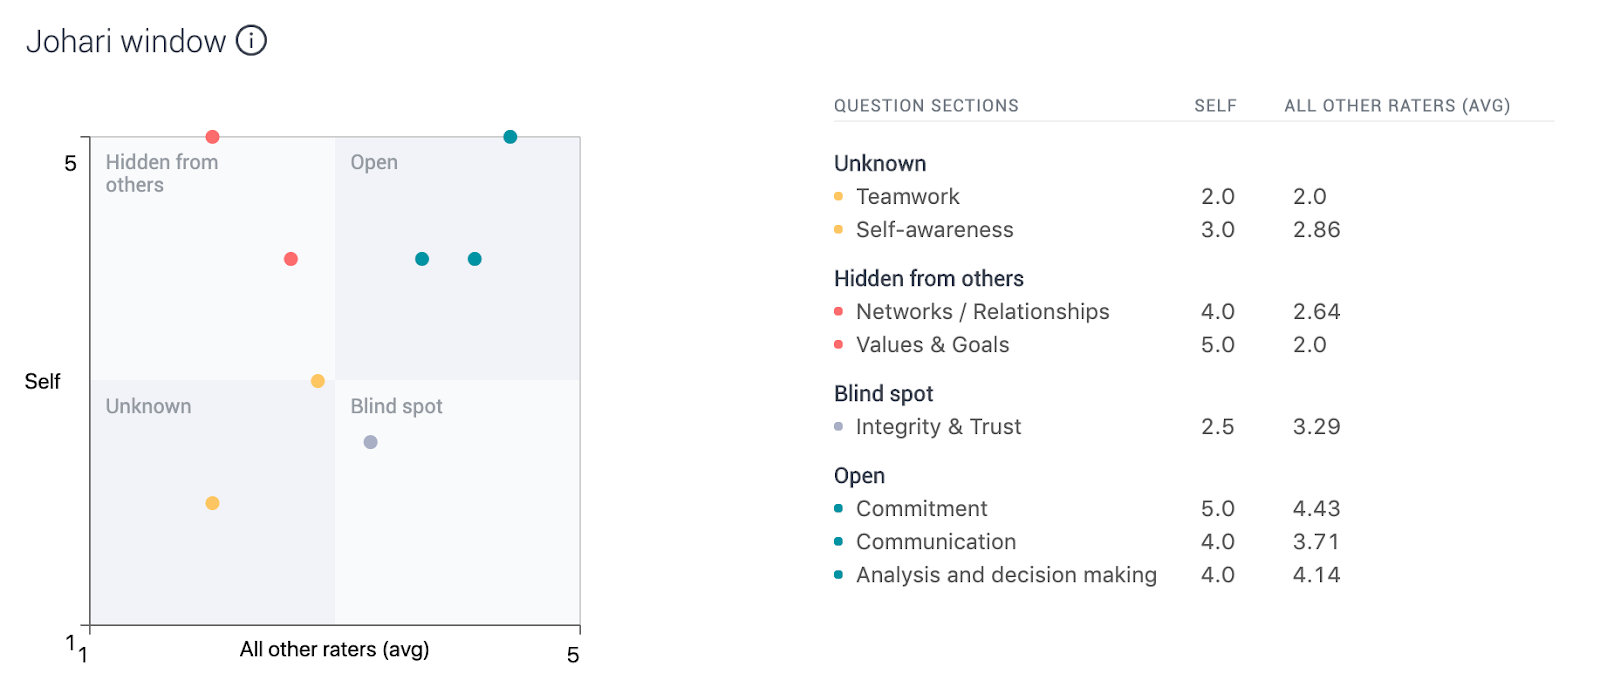
Johari’s Window
Johari's Window allows you to compare the reviewee’s self-assessment against that of other reviewers. All question sections within the review are reflected in a 2 by 2 matrix with 4 quadrants - Open, Hidden from others, Unknown and Blindspot.
The main application of Johari's Window is to expand the Open quadrant as this indicates that the reviewees and the reviewers are in agreement on competencies that the reviewee uses with a high degree of mastery consistently. You can find a more in-depth explanation of Johari's Window here.
Spider Chart
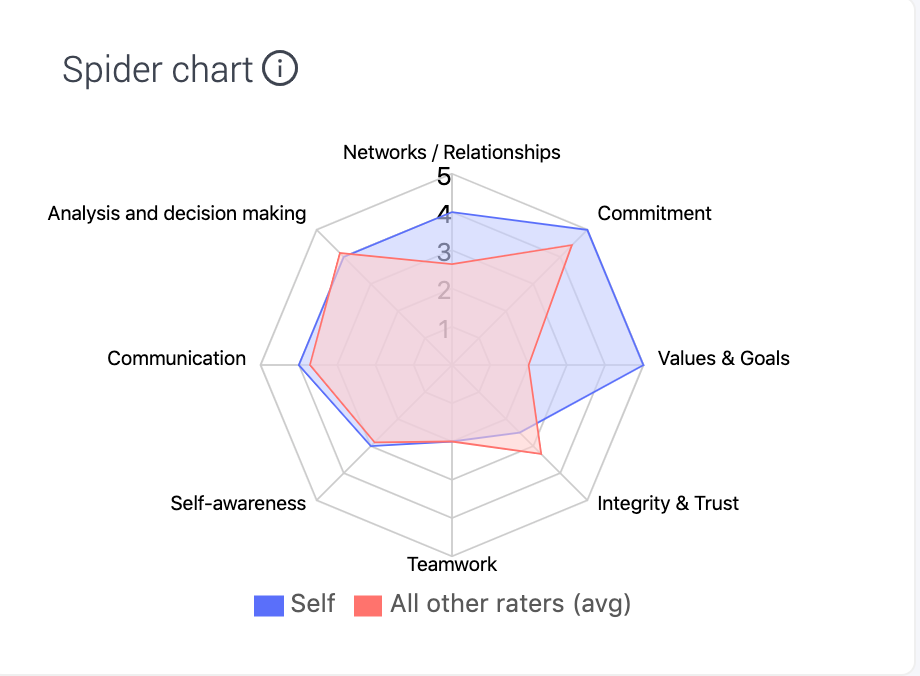
The Spider Chart depicts the intensity of the difference between the self-assessment rating and that of other reviewers’ ratings. The blue line represents the question section score for the self-assessment, whereas the red line represents the question section score for all the reviewers.
Note: Question section score = The mean of all reviewers’ ratings to all questions within the question section, excluding self-assessment ratings. (See below)
Question Sections
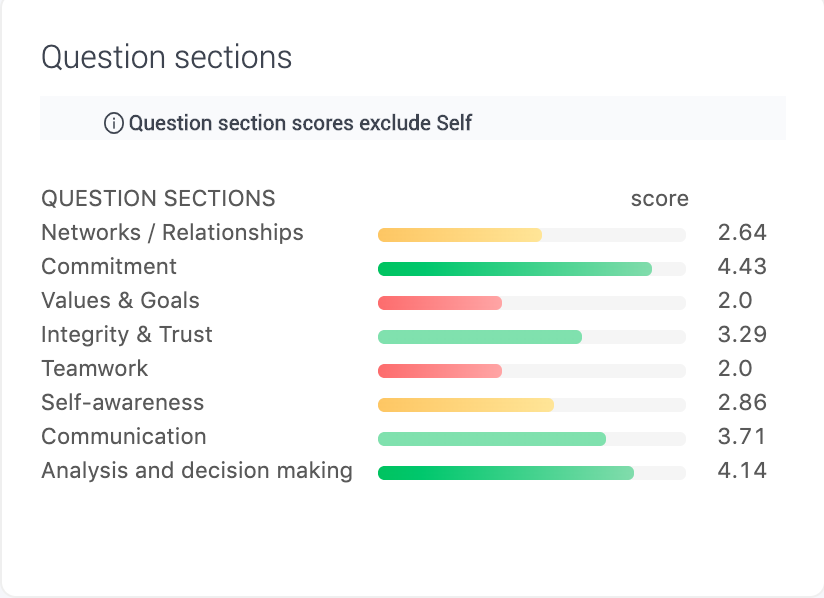
Next to the spider chart is an overview of each question section. The question section score is the mean of all reviewers’ ratings for all questions within the question section, excluding self-assessment.
The scores are also represented in different colours as follows:
-
>=80% is represented in Green
-
>=60% and <80% is represented in Mint
-
>=50% and <60% is represented in Yellow
-
< 50% is represented in Red
Overall Score
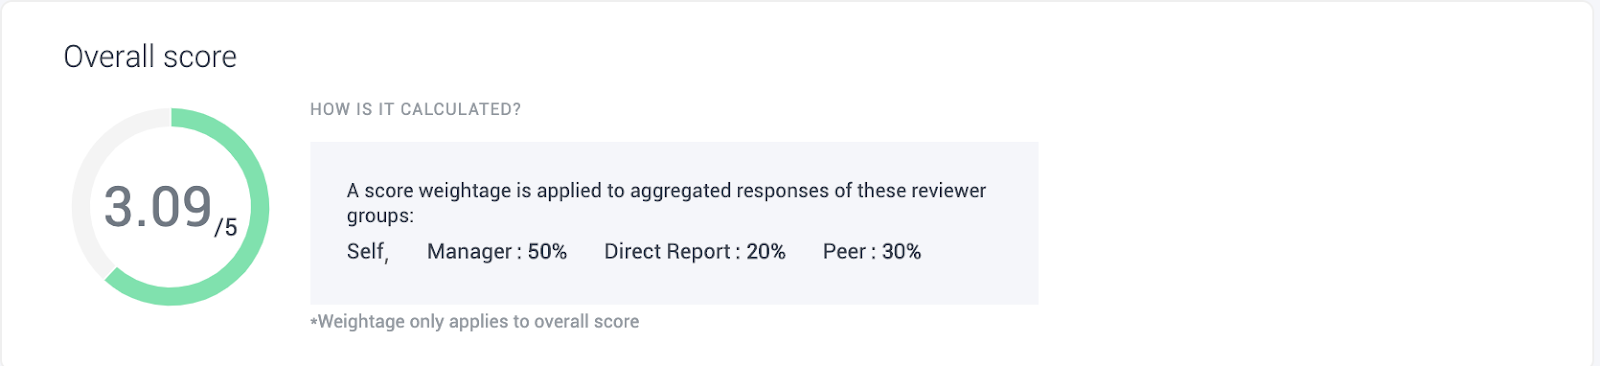
Lastly, most 360-degree or Multi-reviewer Feedback exercise would not include an overall score. Nonetheless, this feature is available and will be displayed if the overall score is enabled in the review settings.
Should you choose to have an overall score during the project set-up, an overall score will be displayed at the bottom of your dashboard.
For the overall score, please note that :
-
Weight % for reviewer groups will be applied based on the review settings
-
If a particular reviewer group does not meet the confidentiality threshold or have chosen “NA” for all questions, both the score of the reviewer group and the Overall Score will be suppressed.
Note : Weight % are not applied to the question scores and question section scores.
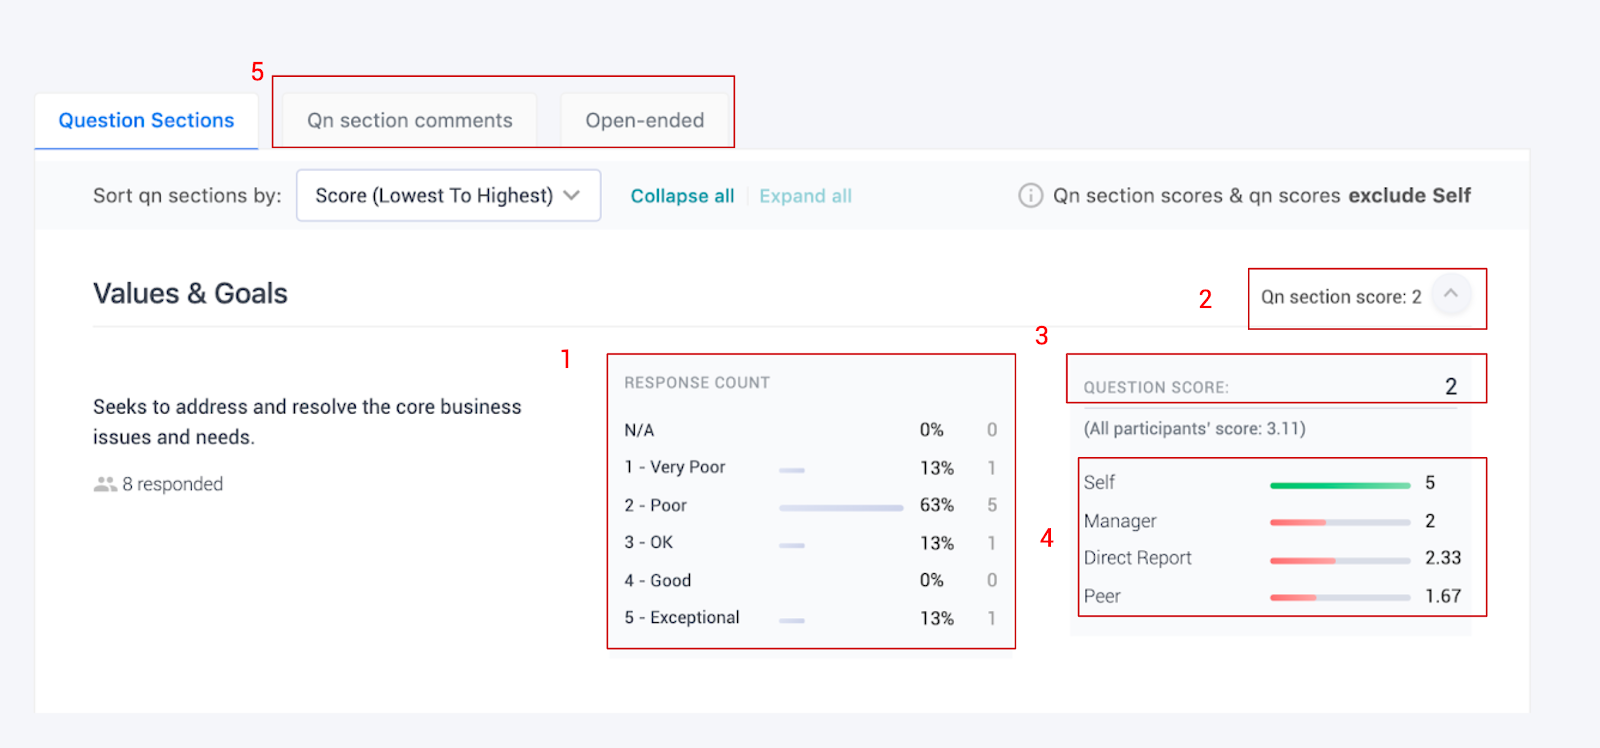
All Questions
When you click on All Questions on the left navigation bar, you will see a breakdown analysis of the scores.
-
The Response Count provides the frequency distribution of the ratings given by all reviewers
-
Question Section Score is computed by the mean of all reviewers’ ratings to all questions within the question section (excluding self-assessment)
-
Question Score is calculated by the mean of all reviewers’ score to the question (excluding self-assessment)
-
Question Score breakdown by reviewer groups reflects the mean of the scores within each reviewer group for each question.
-
Question section comments and Open-ended
Action Planner
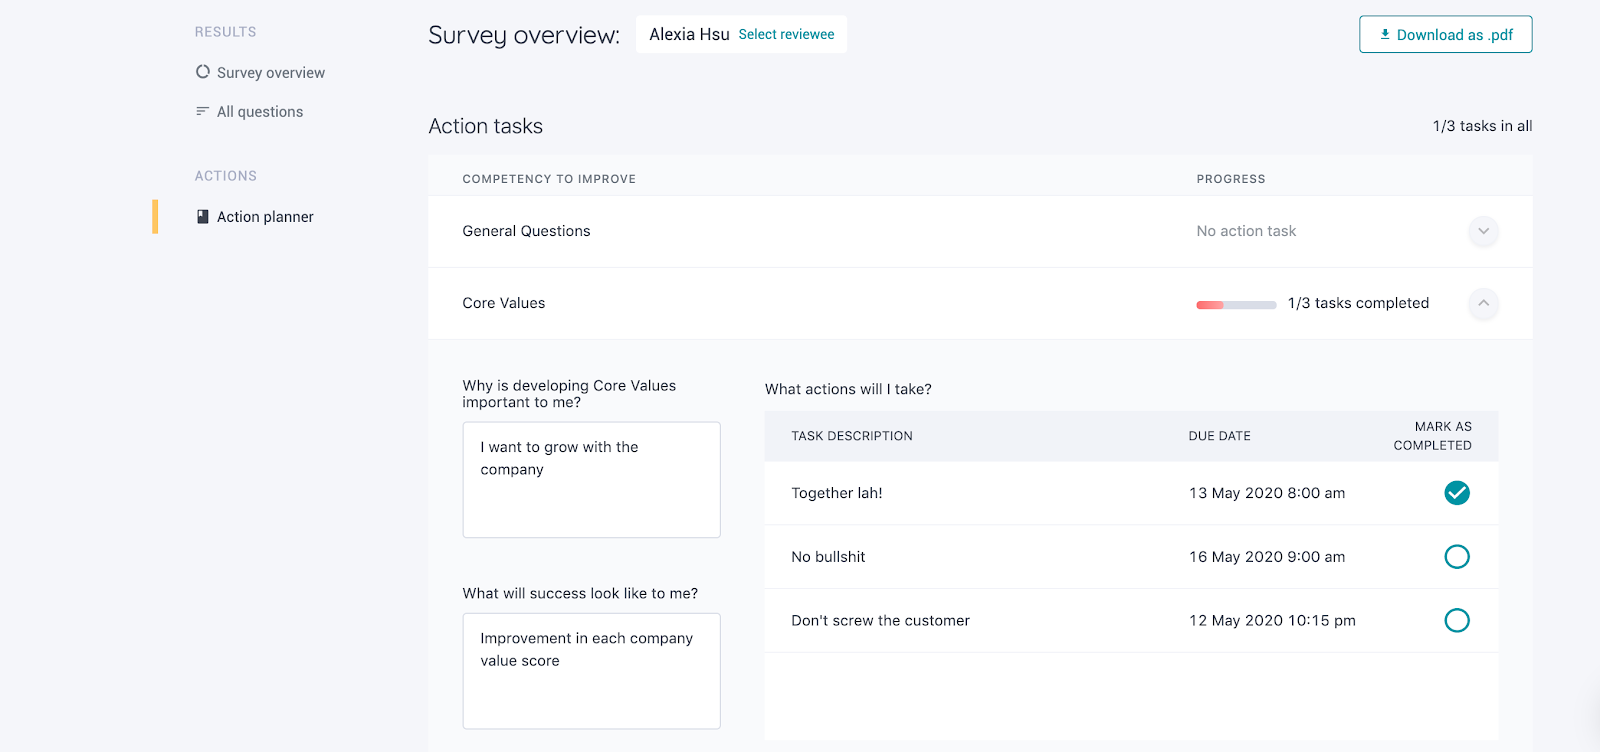
After every 360-degree or Multi-reviewer Feedback exercise, both the reviewee and the report reviewer (who typically is the direct manager or a coach/mentor) should review the results together and have in-depth discussions on the areas of development/growth for the reviewee. At EngageRocket, we provide an action planner so that the reviewee can detail out the action items based on identified developmental areas from his/her 360 exercise. A template is also available within the individual reviewee’s PDF report.
As company admin, you will be able to access the action plans input by each reviewee and monitor the progress on a company-wide level.
Visiting the link will provide you with a deeper understanding of the Action Planner.
For any questions, send an email to our responsive support team at support@engagerocket.co We're here to assist you every step of the way!