While it is important to understand which drivers of employee engagement are doing well or poorly, it is crucial to also understand their impact on an outcome metric that matters to your organisation (e.g. eNPS, which is commonly used as a proxy for employee advocacy and engagement).
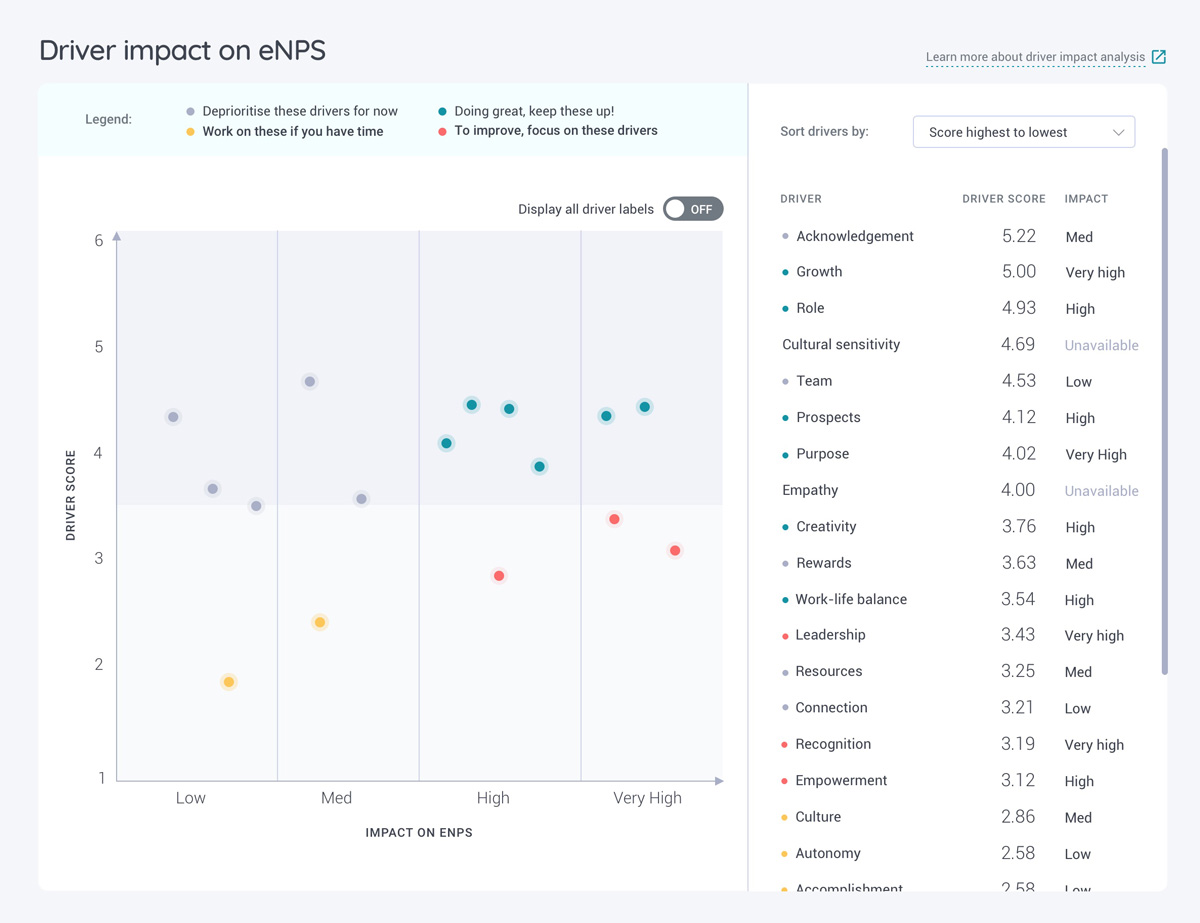
EngageRocket's Impact Analysis chart goes beyond plotting the absolute score of drivers, but also their impact on eNPS. This is to enable a very targeted approach to your interventions by understanding the 4 quadrants:
-
Top Right (High driver score, high impact) - Doing great! Keep an eye on these drivers and make sure they are keeping up.
-
Bottom Right (Low driver score, high impact) - Prioritise attention on these drivers immediately.
-
Top Left (High driver score, low impact) - De-prioritise these drivers.
-
Bottom Left (Low driver score, low impact) - Keep an eye and work on these drivers if additional resources are available.
In the example below, a low-scoring driver like “Recognition” is determined to have a high impact on eNPS, hence improving “Recognition” will most likely lead to a significant increase in eNPS score.
We want to enable People Operation teams to focus on a few key levers that have the biggest impact on employee engagement as it lets you move beyond the "high and low" driver scores to see what is most effective for your organization.
Note 1: The impact scores for drivers are on an organization level. Impact Analysis for smaller teams or departments will lead to data that is unreliable due to the smaller sample size.
Note 2: You may notice that some driver impact is Unavailable. This is shown when we are unable to derive reliable analysis from these drivers. This means that we are not confident that there is any relationship between these variables of interest with respect to the eNPS score.
How robust is the Driver Impact Analysis?
To ensure that the results of the driver impact analysis are robust, we have put in place a minimum number of responses required for the analysis to take place. The analysis will run when the number of responses is greater or equal to 60. On the other hand, when the number of responses is less than 60, you will see the following message "Driver impact analysis will be displayed when there are at least 60 responses." If you have more drivers, you should aim to capture more responses for the driver impact analysis to be robust.
How do we determine the driver impact on eNPS? (for the geeky ones)
A regression model is conducted between each driver (predictor) and eNPS score (outcome) to find the strength of the relationship between them. Through this analysis, we can determine the degree to which the drivers (e.g., Autonomy, Job fulfillment, etc) have an influence on eNPS score, this is known as the driver impact score. For drivers with a significant relationship with eNPS, we categorize them into very high, high, medium, and low impact based on the driver impact score.
Regression analysis is useful in helping your organization focus on key drivers that are more likely to increase employee advocacy and improve organizational performance.
For any questions, send an email to our responsive support team at support@engagerocket.co We're here to assist you every step of the way!