
⚠️ Who is this article for? This guide is for users with dashboard access who want to dig deeper into their survey results. If you cannot see the Responses tab, your access level may be restricted — see Understanding your dashboard access level.
The Responses tab gives you a deeper look into how each question performed in your survey. Whether you are reviewing scored questions, reading through employee comments, or checking how multiple choice responses were distributed, this is where you will find it. The tab is divided into sections based on question type — use the left-hand menu to navigate between them.
💡 Where to find it: Navigate to your survey from the Survey Projects section, then click the Responses tab on the dashboard. See how to navigate the survey dashboard overview if you need help getting there.
Scored Questions — Dimensions and eNPS
This section shows results for all your rating scale and eNPS questions, organised by dimension — the category tags assigned to your questions during survey setup.
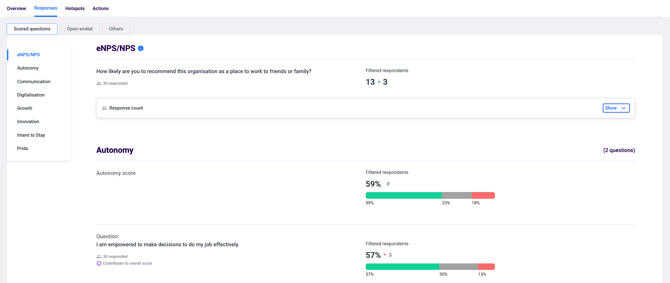
For each dimension you will see the overall Dimension Favourable Score and how it has changed compared to the previous survey cycle, individual question scores showing the percentage of favourable, neutral, and unfavourable responses, and the respondent count for each question.
If your survey included an eNPS question, you can view the full breakdown here — the percentage of Promoters (scores 9–10), Passives (scores 7–8), and Detractors (scores 0–6), along with the calculated eNPS score.
💡 How eNPS is calculated: eNPS = % Promoters minus % Detractors. Passives are excluded from the calculation. Scores range from -100 to +100.
Open-Ended Responses
This section shows verbatim responses from your open-ended questions, giving you direct qualitative insight into what employees are saying. Responses are displayed anonymously, individual employees cannot be identified. A pie chart summarises the overall sentiment breakdown for each open-ended question.

Use the sentiment filter dropdown to view responses by category — Positive, Negative, Mixed, Neutral, or Unavailable — to focus on specific themes quickly.
💡 Confidentiality threshold: If the number of respondents for a specific segment falls below the minimum confidentiality threshold, open-ended responses for that segment will be hidden to protect respondent confidentiality. This cannot be overridden. See what is the confidentiality threshold and why can't I see results?
Multiple Choice and Yes/No Responses
The Others section shows responses from questions that are not scored or open-ended — specifically multiple choice and Yes/No questions. You will see the distribution of responses for each option, making it easy to review how employees answered these items. A historical comparison next to the respondent count also shows how response patterns have shifted over time.

Filtering by Segment
On the Responses tab, you can apply demographic filters to narrow down results for a specific group — for example, showing responses from a particular department or location only. Use the filter panel to select the segment you want to analyse.


💡 Good to know: Filtered views are subject to the same confidentiality threshold as the overall results. If a filtered segment has fewer respondents than the threshold, results for that filter will be hidden.
See how to use hotspots for targeted insights for a visual way to compare segments across questions.
Something Not Working?
Open-ended responses are not showing.
- Likely cause: The number of respondents falls below the confidentiality threshold for that question or segment.
- Action: This is by design to protect respondent confidentiality and cannot be changed. See what is the confidentiality threshold and why can't I see results?
The eNPS score looks different from what I calculated manually.
- Likely cause: Passives (scores 7–8) may have been included in the manual calculation.
- Action: Double-check the formula — eNPS = % Promoters minus % Detractors. Passives are not included.
A dimension I expected to see is missing.
- Likely cause: Dimensions only appear if at least one question was tagged with that dimension during survey setup.
- Action: Check the questionnaire settings to confirm the dimension was assigned. See how to set up your survey questionnaire.
I can see some question results but not others.
- Likely cause: If a question's response count falls below the confidentiality threshold, results will be hidden.
- Action: See what is the confidentiality threshold and why can't I see results?
Still Need Help?
If you have questions about viewing or analysing your survey responses, reach out to us at support@engagerocket.co and we'll be happy to assist!