At EngageRocket, we use a 5-point Likert scale for all of our surveys because we appreciate the option of neutrality! For this article, we will make references to using a 5-point scale but do note that you’re able to decide the rating scale you’d like to use in your own surveys.
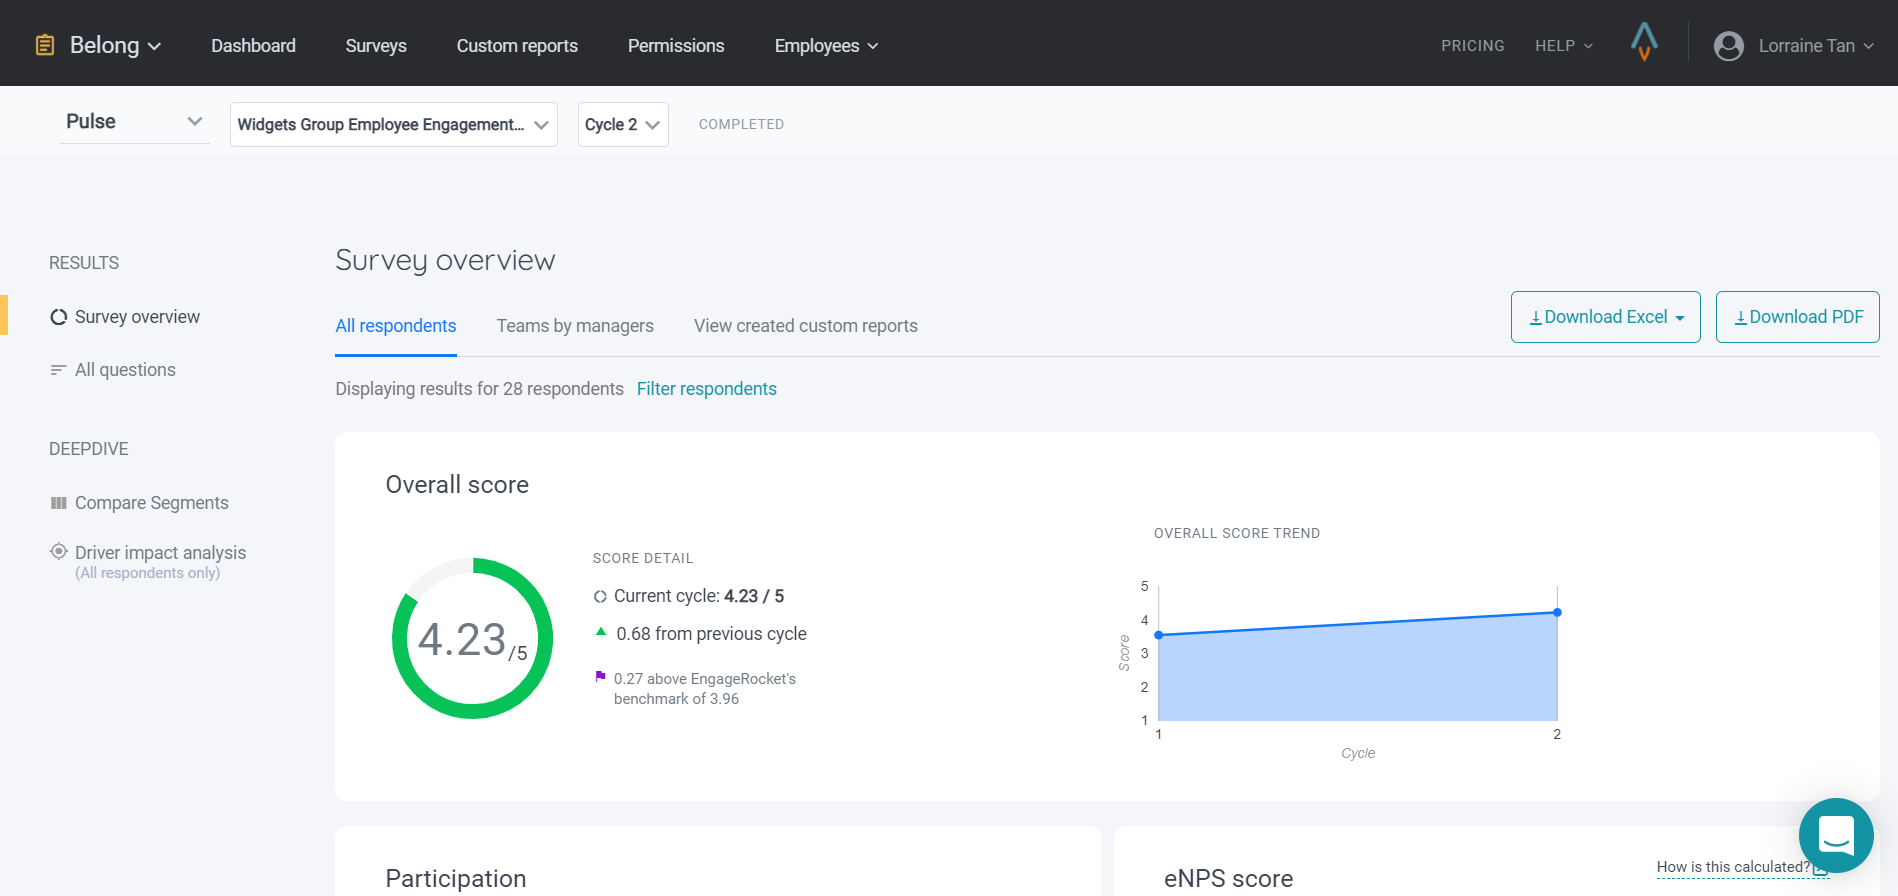
The overall score on your dashboard is calculated by the sum of all question responses divided by the total count of question responses for the questions “counted to overall score”. For the screenshot below, the overall score can thus be interpreted as 4.23 out of 5.
Note: All driver scores are shown on the dashboard take the average of all question scores, both checked and unchecked for “count to overall score”. As such, driver scores need to be separately computed if some questions are checked and others are not.
You will find the overall score under Survey Overview on your dashboard as well as the top statistic bar. Your dashboard visually displays a consistent set of metrics that can be used by your organization at any given point in time (cross-sectional), and you can also track these metrics over time (longitudinal). Managers can easily communicate trends across the cycles with key stakeholders by exporting results into PDF or excel.
Each driver is broken down into the questions that make up the driver. Clicking on an individual driver would display the individual scores for each survey question. You can even see the change in the aggregate score of each driver overtime under the column Change. It can be interesting to see how you fare on different drivers/questions.
WHAT IS A GOOD SCORE?
If this is your very first measurement, your score will serve as your baseline. Any improvement in the score moving forward will be considered good news.
Our dashboard also informs you of the net change of the overall score from the previous survey cycle and graphically trends the data over time.
If you are using EngageRocket’s Default Engagement Questionnaire, you may retrieve the benchmark data under Compare Segment on the left panel.
At EngageRocket, we caution against an overemphasis on the overall score. In the end, it is the action post-measurement that truly matters! Dive deep into the data by exploring the Compare Segment, where you can slice and dice your data to understand which areas of your organization need priority in action. You can also read detailed responses from your employees via the Open-Ended Questions tab.
For any questions, send an email to our responsive support team at support@engagerocket.co We're here to assist you every step of the way!