What we will be covering :
-
Survey overview
-
All questions tab
-
Compare segments
Survey Overview
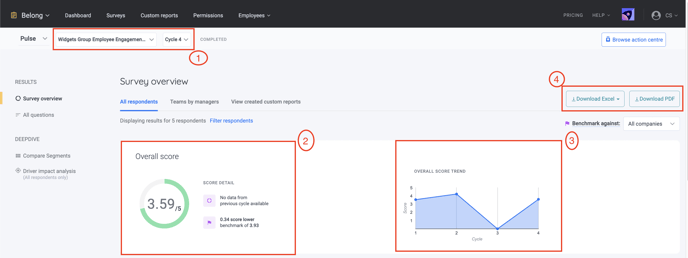
The goal of the Survey Overview is to provide a high-level view of the survey results for your team. When your survey is in progress you can see the real-time participation rate and overall score on the Survey Overview page. Click Participants to view the list of all the participants who are part of the survey.
-
Select the Survey and/or Cycle results that you would like to analyze.
-
This is the overall score of your survey, which is calculated by the sum of all question responses divided by the total count of question responses for the questions “counted to overall score”.
-
This graph shows the trend of your cycle scores - hover over to see the overall score of each cycle!
-
You can download the survey scores by clicking on either Excel or PDF. If you’re an admin, you can also choose to see the results for one specific manager by selecting the Team by managers tab.
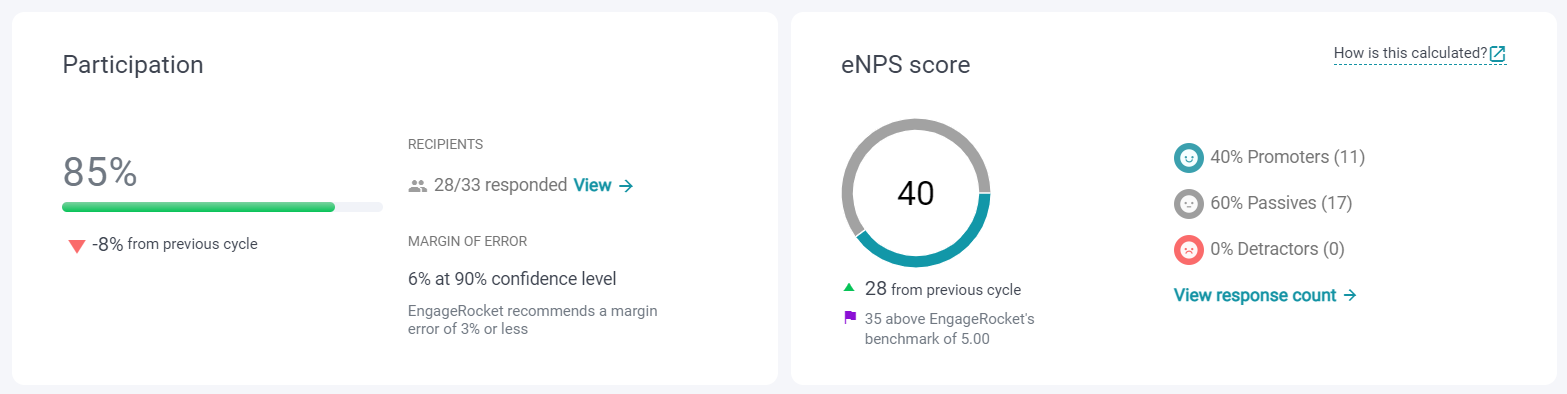
The next part of the dashboard brings you to the participation rate and eNPS score.
-
The participation rate of the survey.
-
Your team's eNPS (Employee Net Promoter Score) serves as a proxy for employee advocacy.
Scroll down and get an overview of the driver scores, top managers, and improvements.
-
The driver scores show the breakdown of the scores by drivers, as well as displaying the top and bottom driver, together with the biggest drop and improvement.
-
Top 3 managers and top 3 improvements are displayed here, including the comparison against the previous cycle, if applicable.
Understanding the All questions tab
Over at the All questions tab, you are presented with the different tabs in your survey, eNPS, Drivers by the question, and Open-ended questions. Data is shown with the response frequency. For driver scores, you can also view them accordingly to favourable scores.
Driver scores
Driver scores and scores for their individual questions can be viewed here. The breakdown is shown by the response count. You can also select to view the data by favourable score.
Open-ended questions
In the Open-Ended tab, you can read all the open-ended answers that employees have submitted.
-
If you have several open-ended questions, you can choose the question from the question list on the left-hand side.
-
Open-ended responses can add context to the survey scores that enable you to better understand what your team members are feeling at work. Each open-ended response is analysed in 2 ways, either sentiments or topics:
-
Sentiments: Each open-ended response will be analysed for the emotional tone underlying it, and the possible sentiments are Positive, Negative, Neutral, and Mixed. If the open-ended comment cannot be analysed effectively, it will be tagged as Unavailable.
-
Topics: Each open-ended response will be analysed to understand the topic or theme underlying the content/text, and there may be multiple topics tagged to it. To view the topics that emerge from the open-ended responses and which open-ended responses fall under them, select "Responses by topics". As a company admin, you have the flexbility to add/remove/retag the topics by clicking on the "Edit" button within each comment.
-
Compare segments
The ability to slice and dice the analysis from EngageRocket is one of the most useful ways to dive deeper into your data to understand the pockets of strengths and opportunities within your organisation. EngageRocket’s compare segments tab presents the data in a heatmap format and just like a weather map, you will see where the hot spots are, where support is needed and where sources of best practices lie.
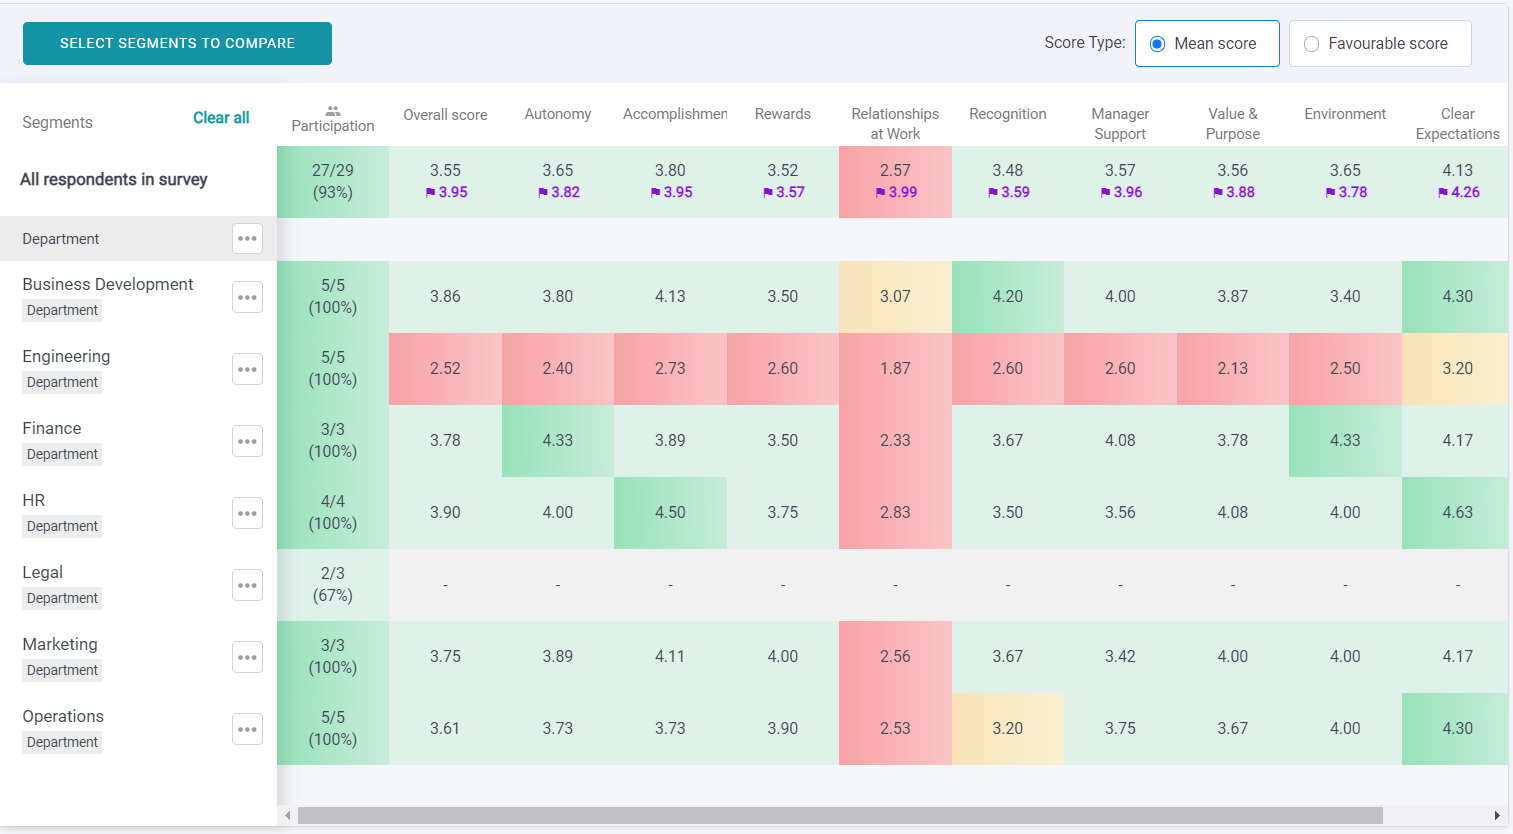
You can read more about the compare segments page here.
For any questions, send an email to our responsive support team at support@engagerocket.co We're here to assist you every step of the way!